|
Steve Mortimer Bar
>> Forward to Belmore
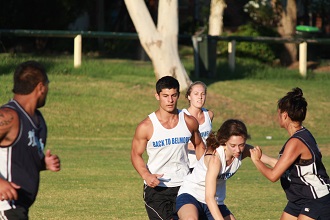
In the Canterbury-Bankstown district, sport is an integral part of community life. It is not only a way to stay active, but also a powerful means of bringing people together to tackle important issues and inspire lasting change. Participation in sport plays a vital role in helping young people lead balanced, successful lives - and quality sporting facilities are just as essential to nurture the talent of the next generation of athletes. |
|
|
Forward to Belmore is a community initiative by Back to Belmore Inc. Established in 2011, this program was created to raise funds and award grants to local athletes in the Canterbury-Bankstown area. It grew out of our well-known "Save Belmore Sports Ground to Save Local Sport" campaign, which highlighted the importance of protecting this historic venue for future generations. |
The goal of Forward to Belmore is to provide financial support that helps young athletes achieve excellence in their chosen sports while pursuing their goals and ambitions. Our primary focus is to assist youth and support their development as future sports stars. Through this initiative, we aim to raise funds, develop programs, and create opportunities that unlock the full potential of the Canterbury-Bankstown district's next generation of athletes.
|
|
|
The Forward to Belmore initiative encourages participation in sport and recreation across all codes and age groups. Back to Belmore Inc. receives many requests each month from local sporting groups seeking donations or assistance. While we wish we could fulfil every request, the demand often exceeds our resources.
All applications for funding under the Forward to Belmore initiative must be submitted in writing, on official organisation letterhead, and addressed to:
Back to Belmore Inc.
Forward to Belmore Initiative
P.O Box 87
Belmore NSW 2192
Please note: Email requests cannot be accepted.
|
|


_small.jpg)
_small.jpg)